THESIS BLOG - POST 4 - PROTOTYPE 2

This week we are rehearsing our upcoming research presentation, and I’m trying to reflect on the process I’ve done so far and try to materialize the direction I want to take for thesis. Needless to say, cities are deeply complex systems built upon more complex systems and structures. It’s hard to dissect a small piece of the city for a project that fits a reasonable scale for the timeframe we have available.

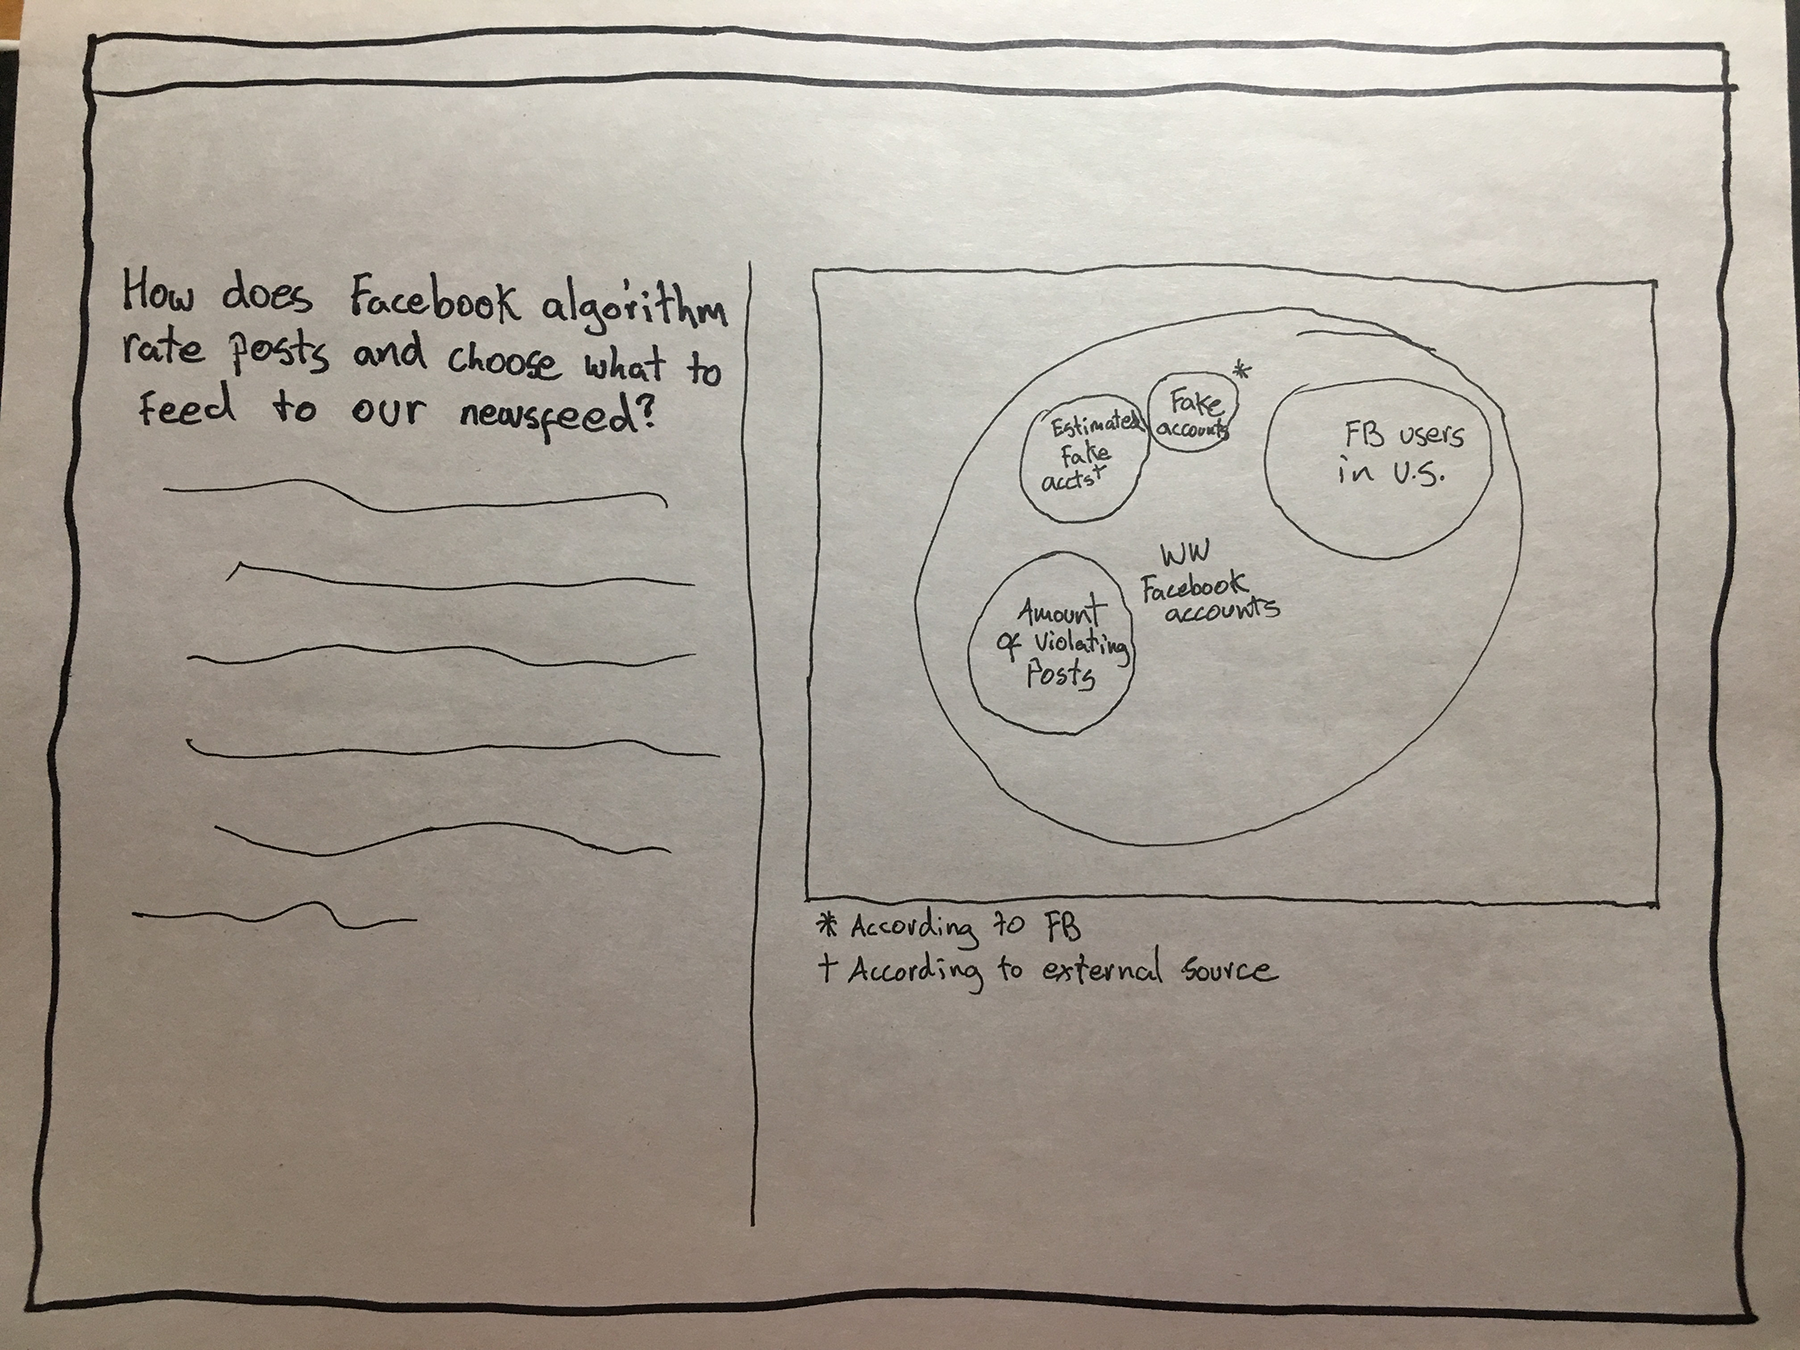
A friend suggested I narrow down the topics I am interested in by creating a domain map and subsequently creating sub-domains that narrow down the topics to fewer and smaller elements. I thought that was a great idea and created a D3 element that tries to do just that.

Thesis Blog - Post 2 - Prototype 1

Last week I was thinking about the 'Smart City' and how emerging technologies all have a designated space for when they are able to reach the adequate efficiency and scale. I've been reading Smart Cities by Anthony Townsend and learning about the history of tech giants such as IBM, Cisco and Siemens. The book talks about the technologies they invented, how they shaped cities and how they would like to shape the future of cities. It's a visionary—and sometimes scary—look into the future.

As these tech giants grow and aim to hyper-connect our world, Townsend also remembers the relationship of Ford and the cities, and how interstates were built over neighborhoods to connect the car to the city. Today's companies want to connect multiple technologies with the city, and although most of them offers amazing benefits, we must not forget that ultimately we build cities for humans. Humans are the ultimate reason why cities and their systems exist. Not only that, humans keep these systems going.

Deciding if and where these technologies should exist in the city means we first need to understand what they do and how they do it. Understanding this has led us to push for more transparency on how a software works (open source software) and how data is used (open data). This are movements that have existed for a while and their labor has led to a more open discussion on how software and data should be used by governments and companies. With the development of machine learning and its use in multiple new areas of society, I believe it's time we have a more open discussion about the algorithms that work behind the scenes.

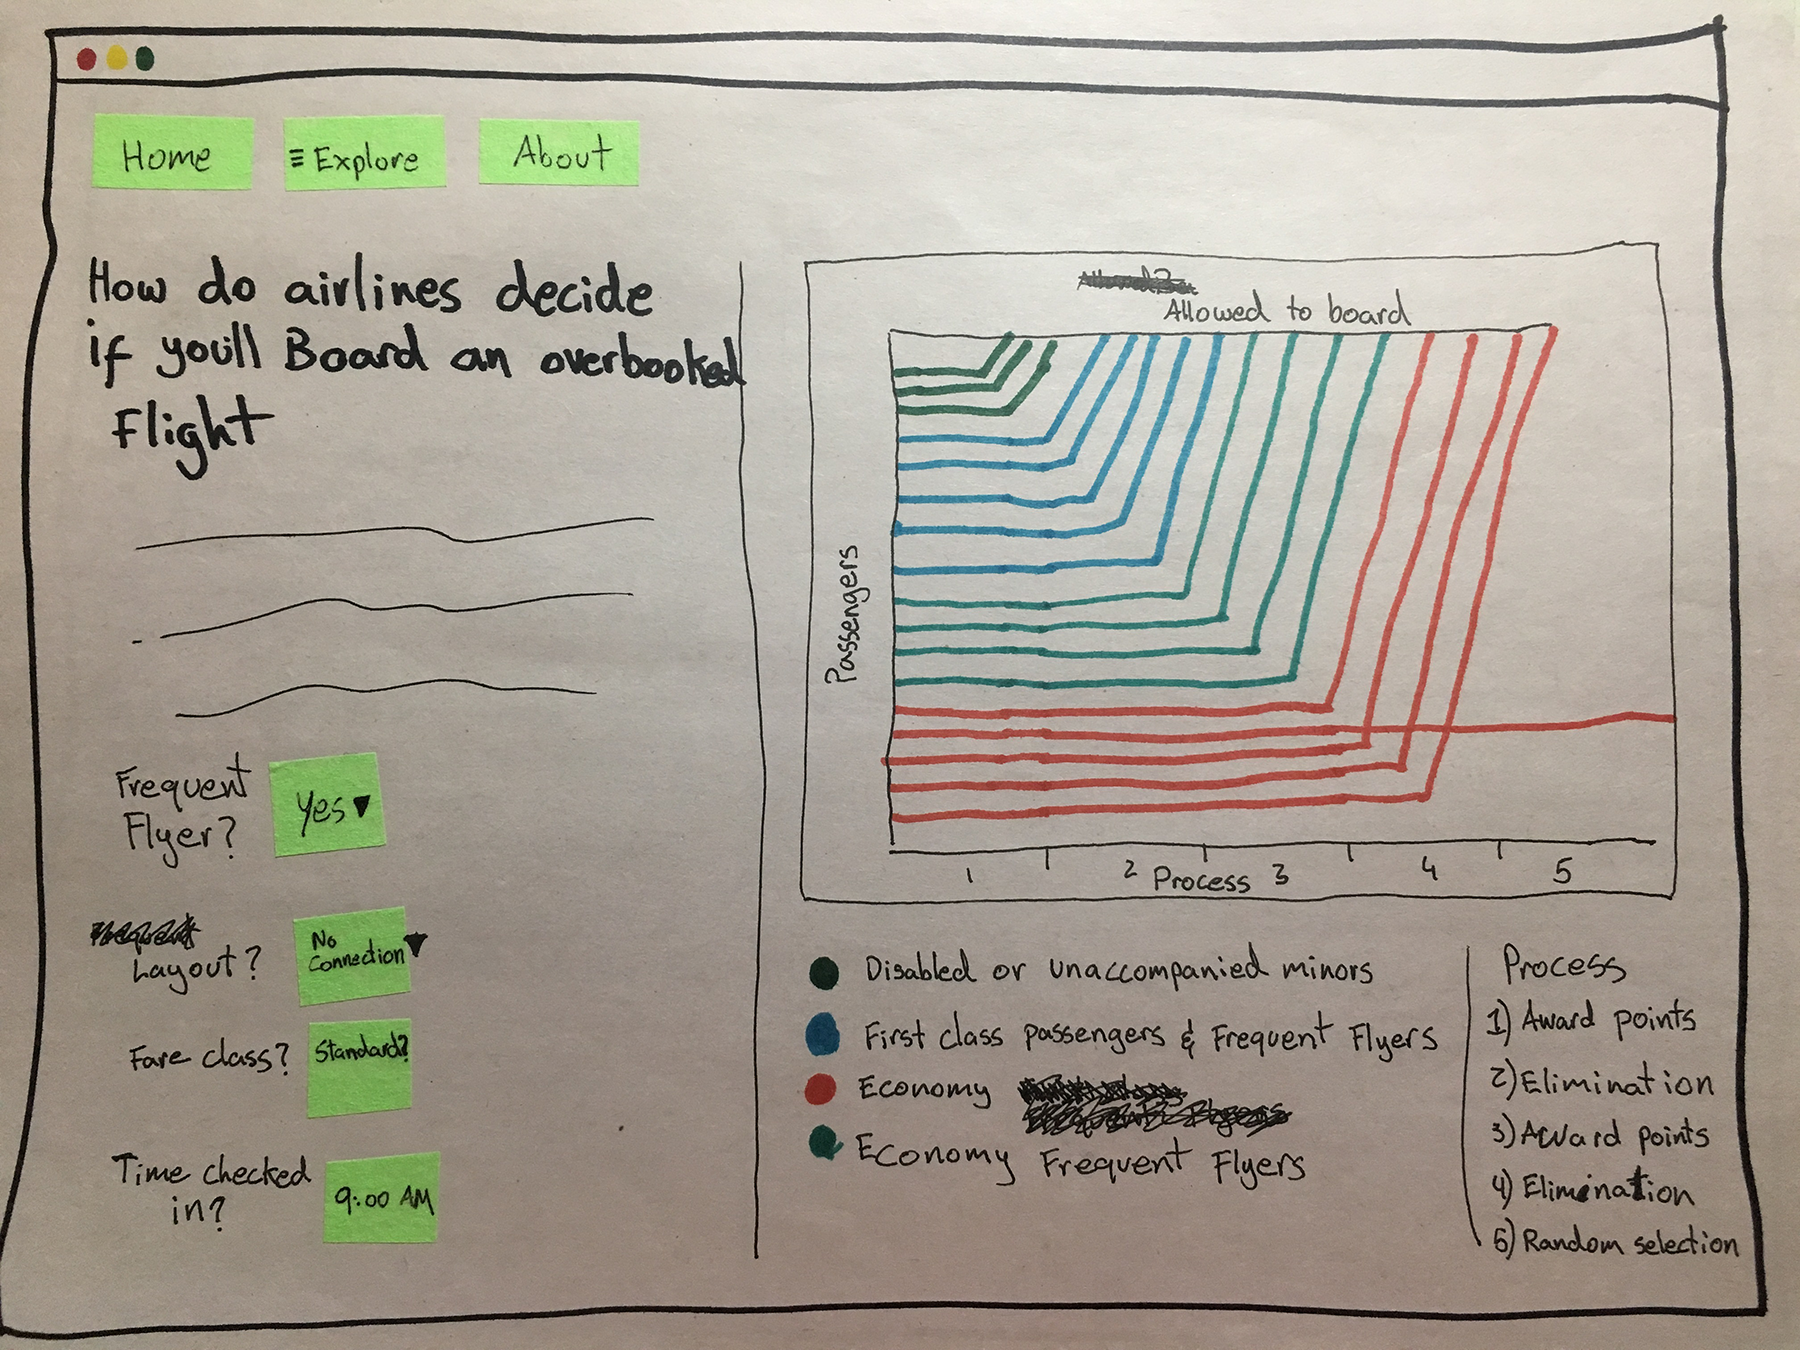
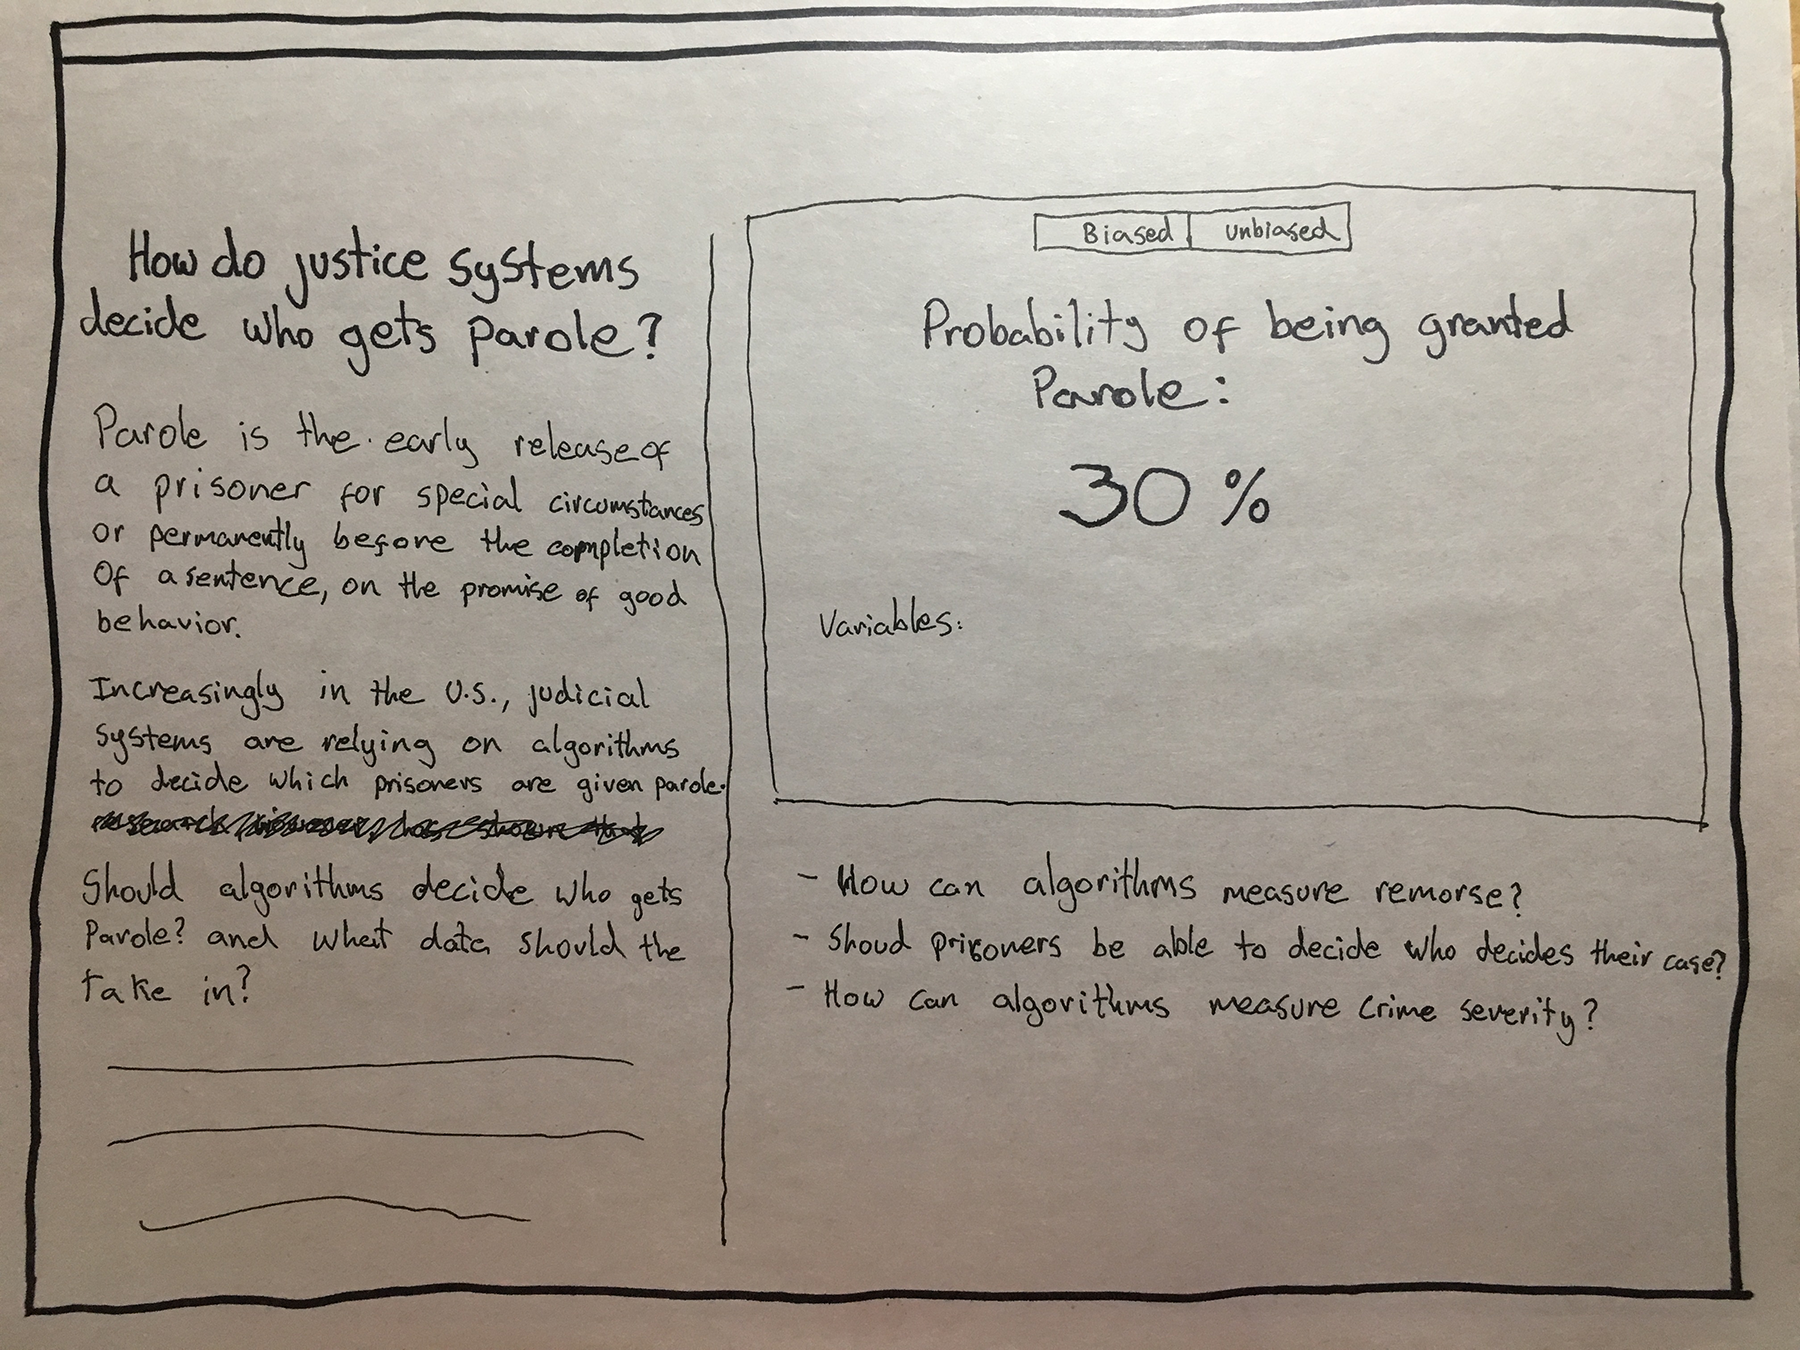
As the Technology Review points out Biased Algorithms Are Everywhere, and No One Seems to Care (Technology Review, 2017). It's important that we care about this algorithms, because they decide many important things in our lives, like who gets a loan, who gets parole and who is bumped from an overbooked flight. Furthermore, this month, September 2018, representatives from Facebook, Twitter and Google will talk to congress about "the role of the world’s largest technology platforms in the spread of political propaganda, extremism and disinformation" (Financial Times, 2018) amongst other things. However, Financial Times also points out that one of the key points congress should discuss with these companies is their use of algorithms and the level of transparency this formulas should have.

The time has come for Silicon Valley to open the black box and reveal how the algorithms work. Trust in democracy, and capitalism, depends on it. (Financial Times, 2018

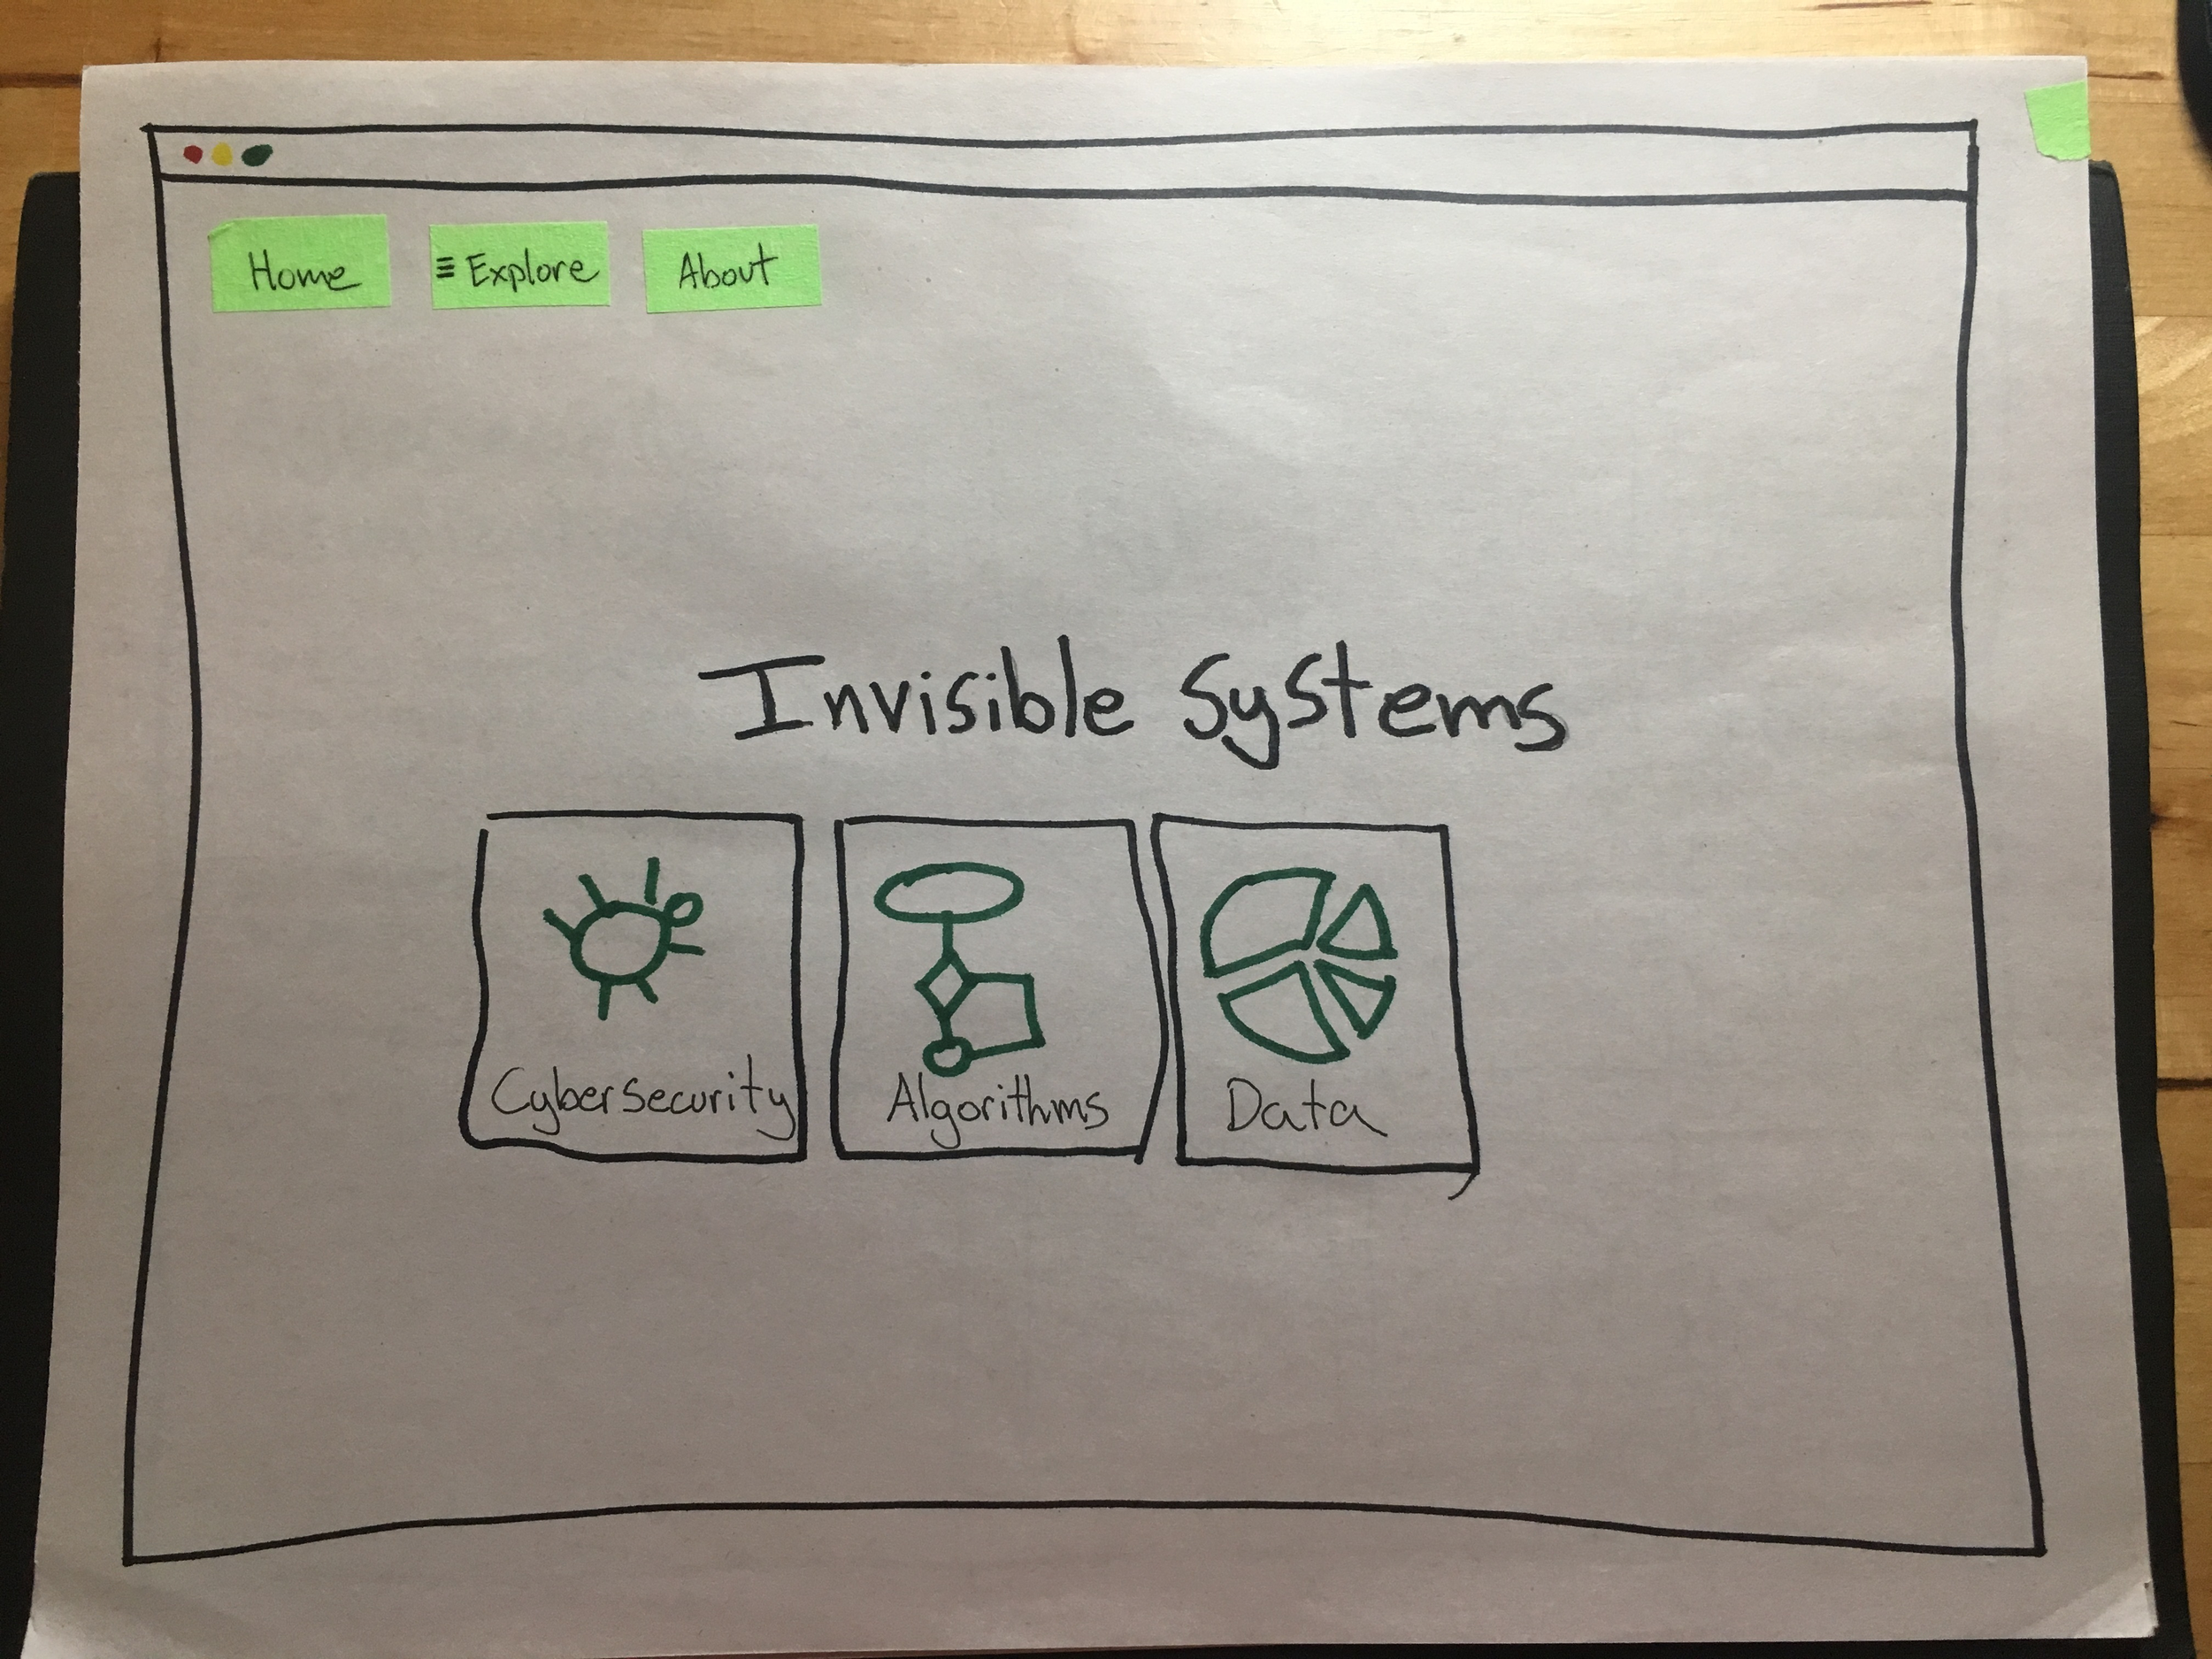
I am not a mathematician nor a physicist, so I don't understand algorithms that well either, therefore my question this week explores the question "How can we visualize algorithms that exist in our daily life in order to understand them better?"

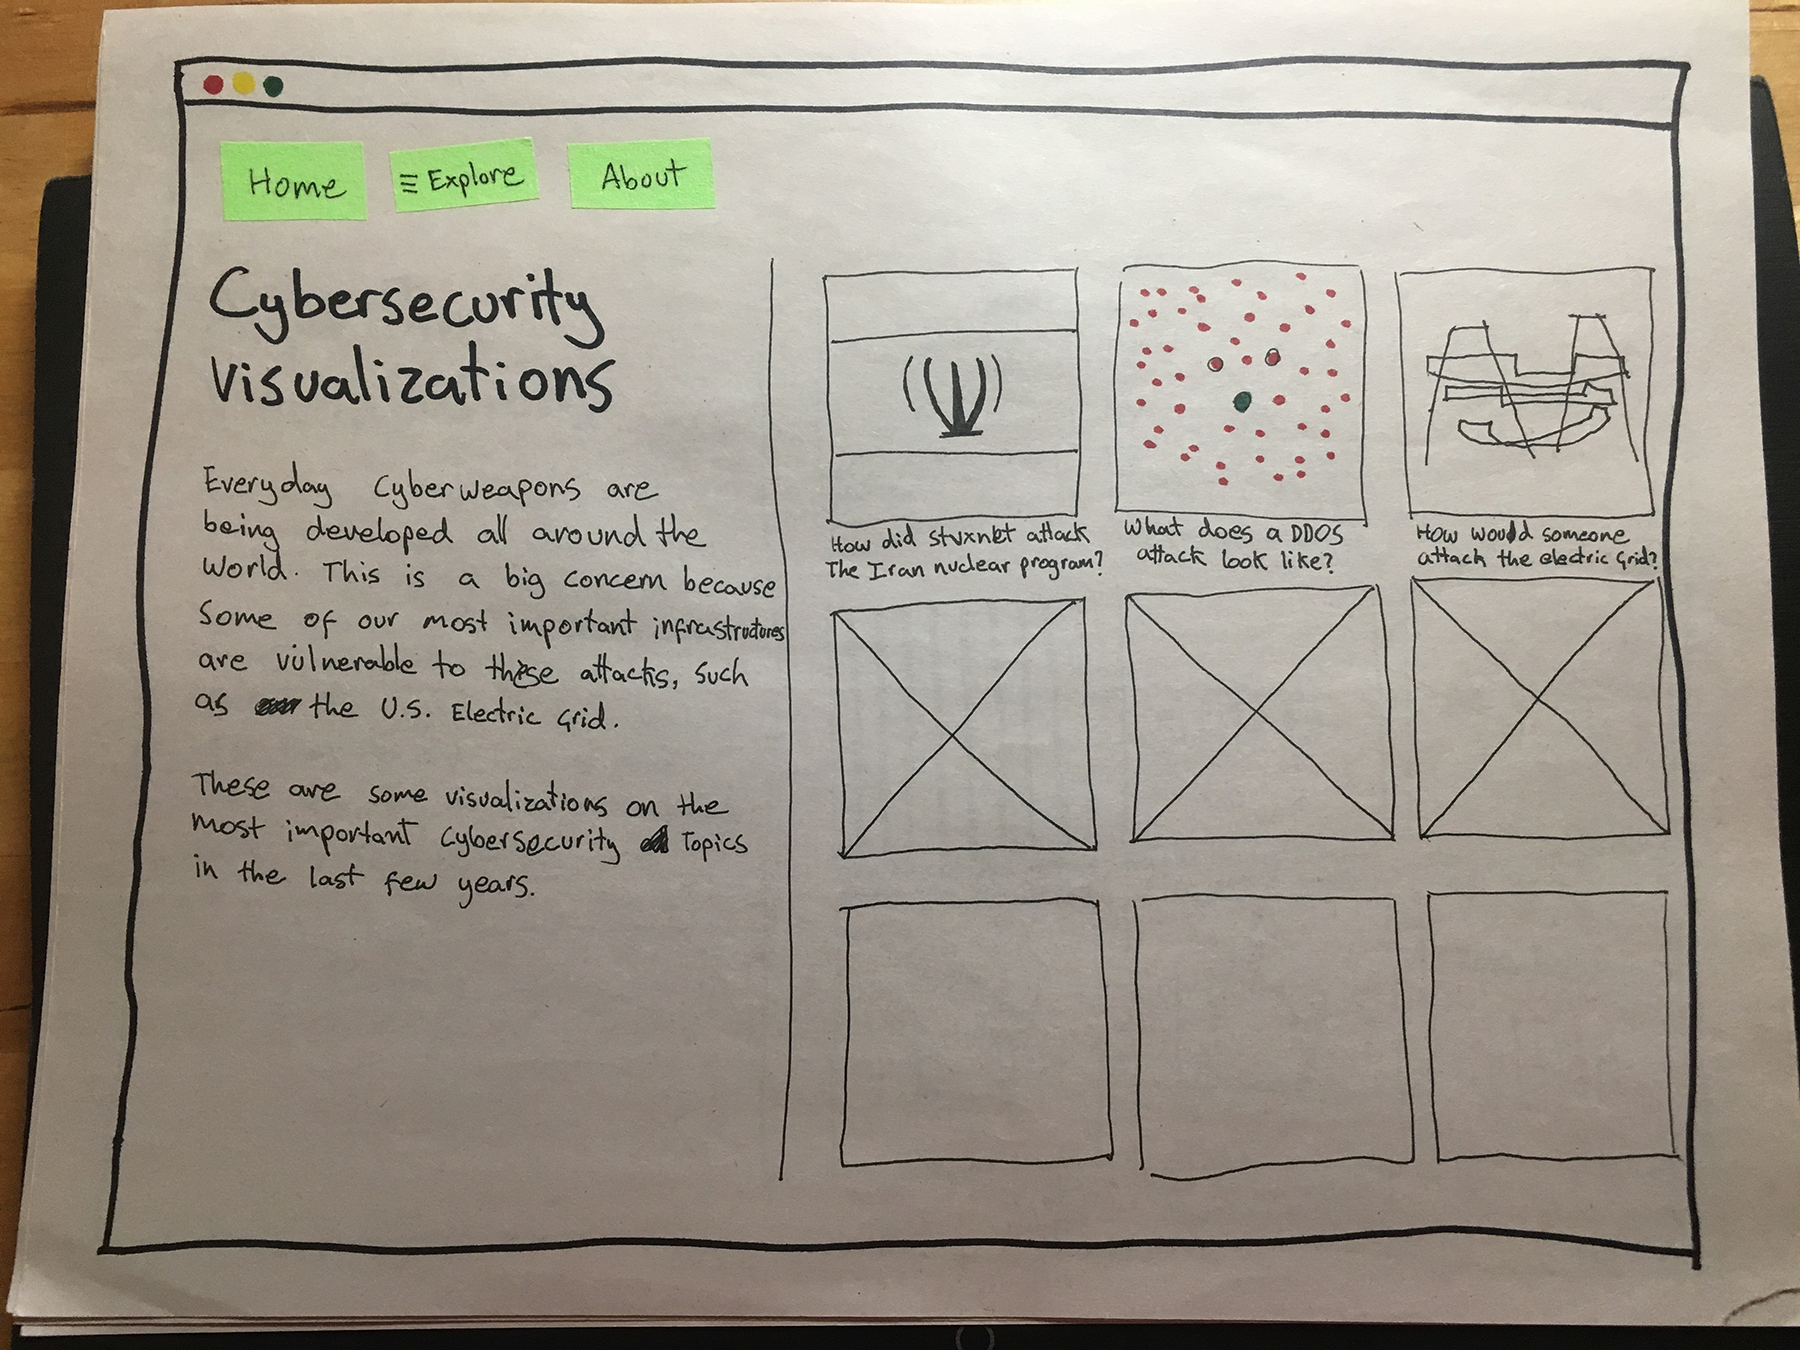
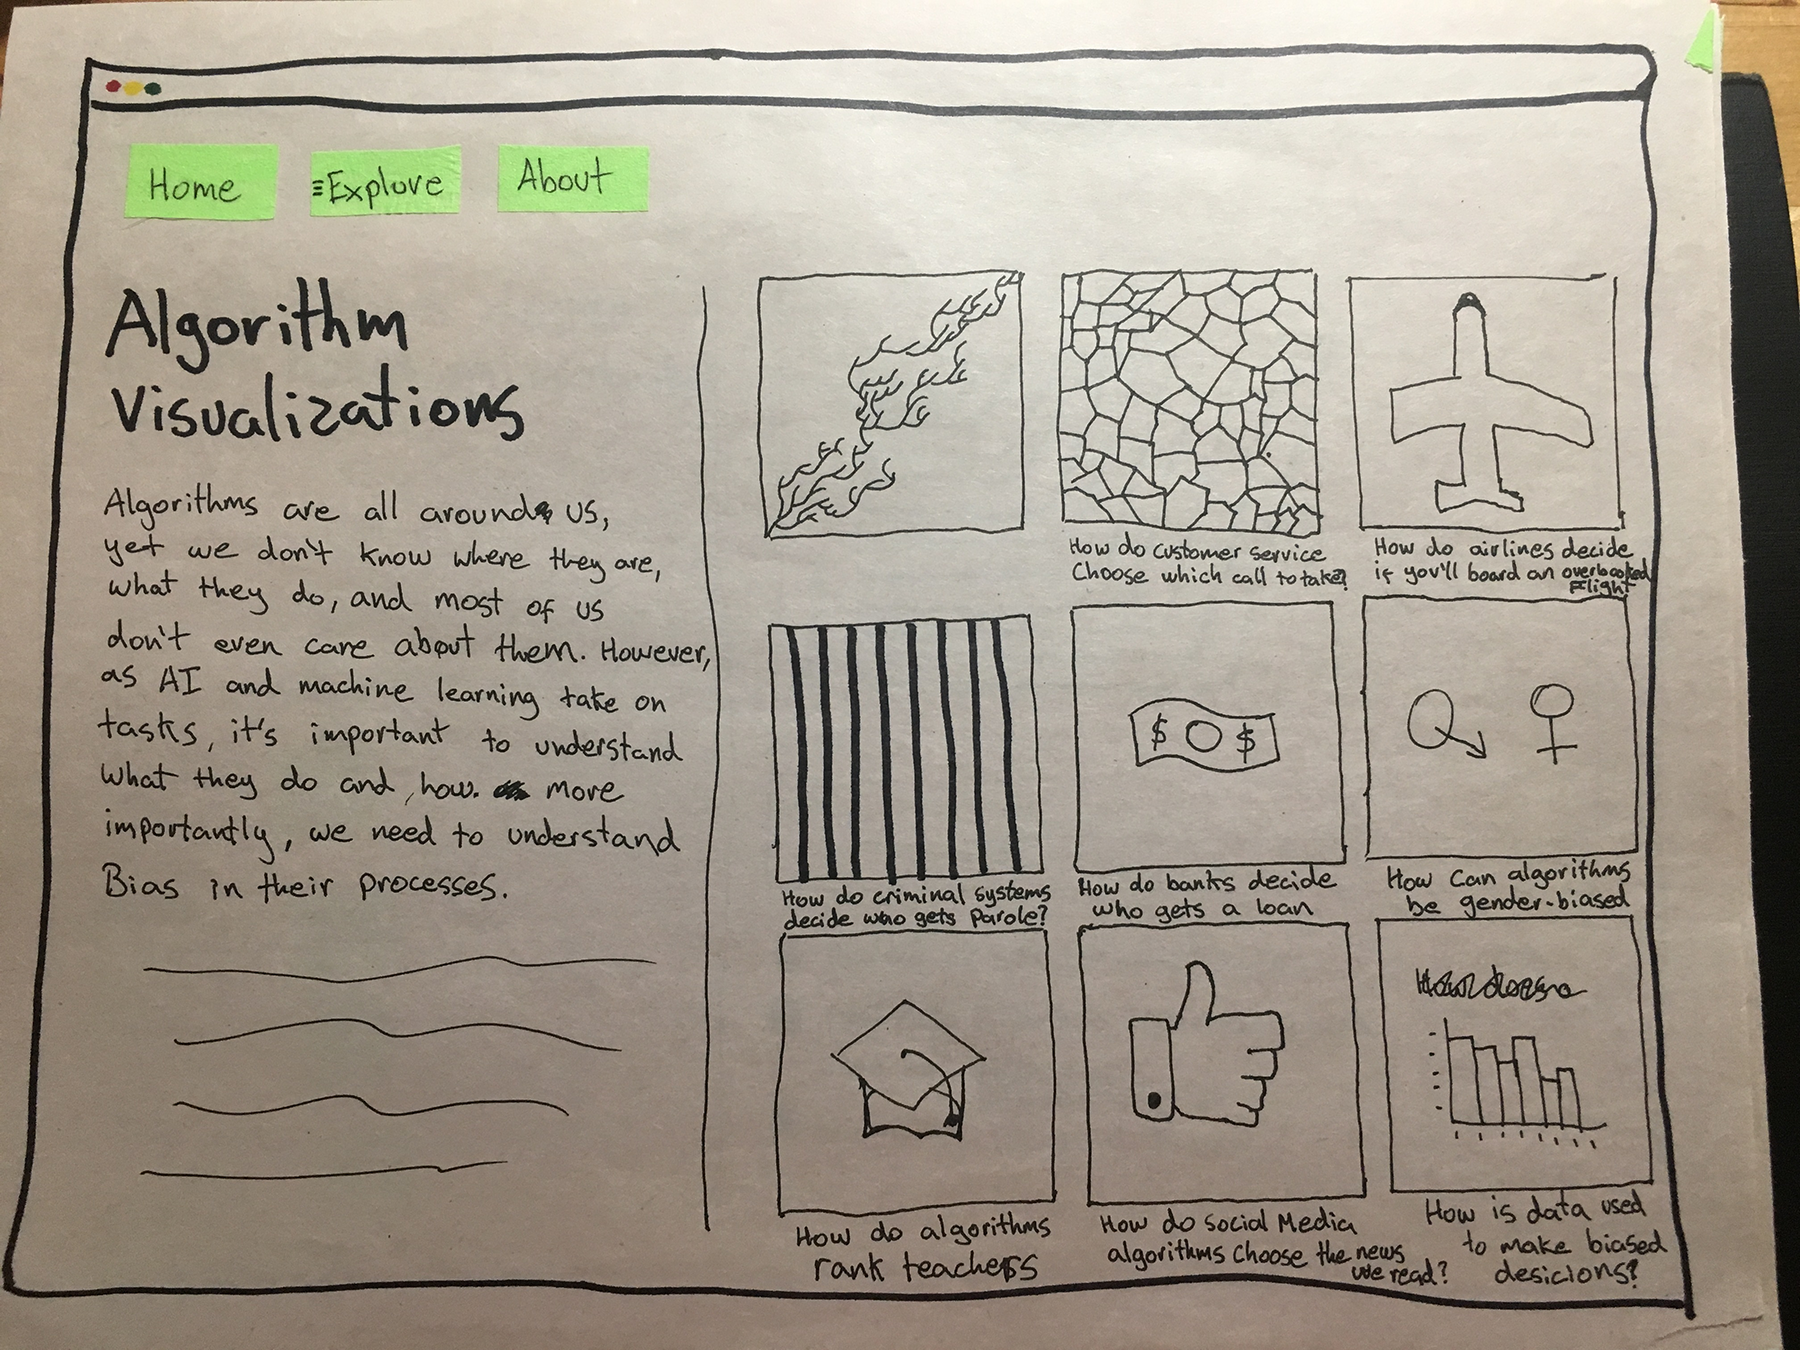
I find this question extremely interesting, not only because of what it represents in terms of our relationship as humans with this technology, but also because of the aesthetic beauty of visualizing algorithms. Mike Bobstock, has an amazing talk at Eyeo 2014 on visualizing algorithms. All of this sources and information led me to create this prototype which aims to explore how algorithms in our daily life might be visualized in a web environment.

Thesis Blog - Post 1 - Prototype 1

Thesis has begun.

Yesterday, our class had its first meeting to kick off the first semester of this journey. Anezka and Andrew introduced themselves and went over the plan for the semester.

We also reviewed some of the exercises we did over the summer. For example, I developed a concept map around the topic of Urban Interaction Design.

IMG_9313.JPG

Soon after that we did our first activity where we were asked to write our current thesis question in a large piece of paper and go around to others' question to add questions the why, who, when, what and how. This is the end result:

IMG_9308.JPG

Although I don't know yet what my research question will be, I am excited to get started with the process of reaching that question, and I look forward to the work ahead.

CC LAB: OpenFrameworks Add Ons Homework

For my last openFrameworks homework I continued to explore the GUI add with the flocking particles. In my first try, I managed to change the color of the particles, but now I wanted to modify the size of the particles. This is the final result:

CC LAB: JAVASCRIPT FINAL

For my final CC Lab project I wanted to do a data visualization based on the tracks of a playlist. Looking into the Spotify API, the data within the tracks has a data point called "Popularity" which ranges from 0-100.

I wanted to use this data point to feed the radius of the circles in the D3.js visualization. This is a example of what I want the the visualization to look like: 

Screen Shot 2017-11-02 at 5.36.08 AM.png
 

I managed to connect to the Spotify API by using Node.js and NPM. Here's a quick look at the Javascript code:

import React, { Component } from 'react';
class App extends Component {

  constructor(props) {
    super(props);
    this.state = {
      query: "", // my query
      artist: null,
      popularity: null  // my response.
    }
  }

  search() {
    console.log('this.state', this.state);
    const BASE_URL = 'https://api.spotify.com/v1/search?';
    const FETCH_URL = BASE_URL + 'q=' + this.state.query + '&type=artist&limit=1';
    var accessToken = 'BQAgu0C8EljTdiFPVwAg76TCQmL3oiLE3hIqvjkJsA_VQvHkJjDiN-K7nPthlL9V90ng9G2Jm5UUf2tyhf7nuIEJ42-zrkzRdPchcuSsyYvd5bAHhYNrBWERlRy97XmCEskCXqQpFRi4KUliSDx37wfxJrSxCdZ8dkE&refresh_token=AQCOwtU2t0MCD6edIVo8Bv5xrYI9dFYyeLfwyKH8FOOYE3qHBhBBhmfkA5VZKBdLosmAZxyEUoMGqVgyKhTVvk3GeQKXcjGNbNwA6SK5-KpvKKJOddKl-6q6w6EQhq_GiPM'

    var myOptions = {
      method: 'GET',
      headers: {
        'Authorization': 'Bearer ' + accessToken
      },
      mode: 'cors',
      cache: 'default'
    };

    fetch(FETCH_URL, myOptions)
      .then(response => response.json())
      .then(json => {
        const artist = json.artists.items[0];
        const popularity = json.artists.items[0];       
        this.setState({ artist });
      })

  }

  render() {

    let artist = {
      name: '',
      followers: {
        total: ''
      }
    };
    if (this.state.artist !== null) {
      artist = this.state.artist;
    }

    let popularity = {
      popularity: '',
      followers: {
        total: ''
      }
    };
    if (this.state.popularity !== null) {
      popularity = this.state.popularity;
    }

    return (
      // return JSX 
      <div className="container">
        <hr />
        <div className="col-lg-6">
          <div className="input-group">
            <input type="text" 
              onChange={event => { this.setState({ query: event.target.value }) }}
            className="form-control" placeholder="Search for..." />
            <span className="input-group-btn">
              <button 
              onClick={()=> this.search()}
               className="btn btn-default" type="button">Go!</button>
            </span>
          </div>
        </div>
        <hr />
        <div>
          <div> {artist.name}   </div>
          <div> {artist.followers.total} </div>
        </div>


        </div>
    )
  }
}
export default App;

Although I managed to connect to the API and make a successful query, I wasn't able to connect the exact data point to D3.js and alter the radius of the data points.